01
Financial Analytics
Financial performance, valuation, market structure, cycle analysis and investment research.
Valuation · Market research · Financial modelling
I investigate what sits behind the headline metric — across financial research, business intelligence and market analysis — and build the evidence needed to understand what is really happening.
I use data to investigate what changed, why it changed, and whether the evidence actually supports the story being told.
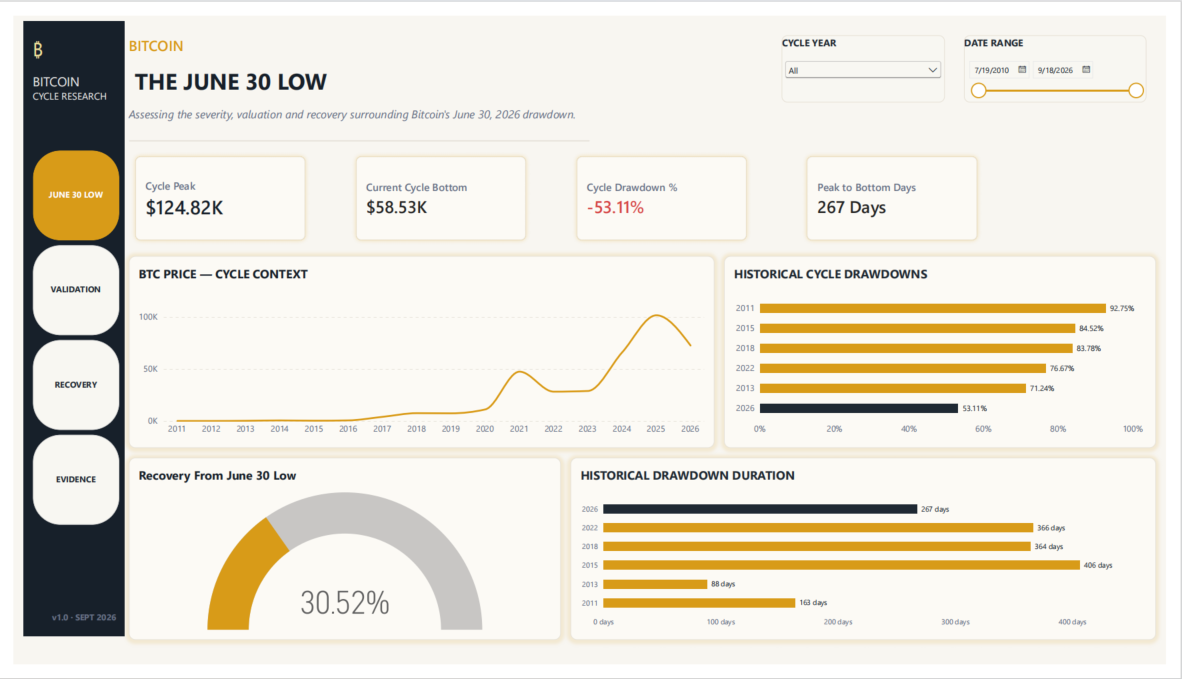
Is the June 30 low a credible Bitcoin cycle bottom?
A multi-layer research project combining market structure, MVRV, realized price, ETF flows, CME positioning, open interest and historical cycle recovery data.
Open research desk →
Each project starts with a specific question and follows the evidence to a useful conclusion — across financial research, business intelligence, market analysis and data analytics.
Is the June 30, 2026 low a credible Bitcoin cycle bottom?
Testing what earnings power the ₦525 IPO offer price requires.
How has the modern World Cup evolved in scale, demand and global reach?
Do promotions actually lift demand, and where is inventory capital getting trapped?
How do creator activity, content engagement and monetization interact across an AI-first content platform?
How much revenue is being surrendered through discounts across a global footwear business?
A multi-page view of loan operations, outcomes and overall finance performance.
What do health investment, workforce capacity and outcomes reveal across ASEAN?
Where are the largest energy-access gaps, and how do they intersect with sustainability?
Turning static office-supply reporting into an interactive view of profitability and customers.
What drove Q4 revenue, profitability and customer performance — and where should attention go next?
Which products, customers, regions and time periods shaped Q3 retail performance?
Why did sales and unit volume grow while profitability compressed?
How much headline revenue disappears through returns and cancellations?
What does the Netflix catalogue reveal about content mix, audience focus and acquisition?
A dashboard is the output, not the investigation. The work starts before the first visual is built.
Define the problem, decision or hypothesis before touching the dataset.
Identify the available evidence, its source, structure and limitations.
Model, query and investigate the data to surface patterns and relationships.
Test the story, challenge assumptions and make uncertainty visible.
Translate evidence into clear findings, frameworks and next actions.
Financial questions, commercial questions and market questions do not always require the same lens. My toolkit lets me move between them.
Financial performance, valuation, market structure, cycle analysis and investment research.
Decision-ready reporting through dimensional models, KPIs, DAX and analytical dashboards.
Structured analysis from raw data through SQL, PostgreSQL, validation and research synthesis.
My experience sits across analytics and research, with each role adding another way of thinking about evidence, performance and decisions.
Analytical work spanning financial analysis, business intelligence, SQL, data modelling, commercial performance, customer behaviour, pricing and research-driven decision support.
Applied analytics work across structured datasets, dashboard development, SQL analysis and business-focused problem solving as part of the AnalystLab Africa Data Analytics Internship Program.
Years of independent research across cryptocurrency markets, market structure and digital assets, including public market analysis, technical research, educational content and community-led research.

That question still shapes how I work. I am a Financial & Market Analyst focused on Business Intelligence, Data Analytics and Research — using data to move from a headline number to the evidence behind it.
I build analytical solutions for performance, valuation and decision-making, combining Power BI, DAX, Power Query, PostgreSQL, SQL and Excel with a research mindset shaped by years of studying financial markets and digital assets.
I'm interested in work where the question matters as much as the dashboard — financial analytics, business intelligence, market research and data-driven decision support.